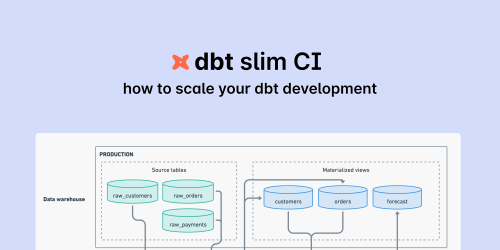
Using Slim CI to scale dbt development: A how-to guide
Slim CI is an effective technique that dramatically speeds up your dbt pipelines during development. Here’s a quick guide explaining what Slim CI is and how to implement it.

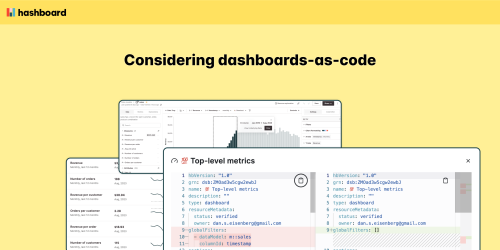
Considering BI-as-Code
BI-as-Code is an approach to analytics that applies software development best practices to ensure data teams deliver reliable, always-current analytics. This approach transforms how organizations interact with their data, making insights more accessible and actionable than ever before.

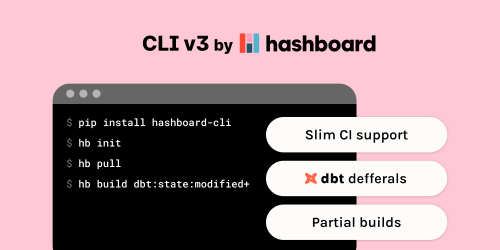
Introducing Version 3 of the Hashboard CLI
Version 3 of the Hashboard CLI adds new features to support larger data teams with advanced development workflows, while simplifying some of Hashboard’s core “BI-as-code” concepts to make them easier and faster to use.

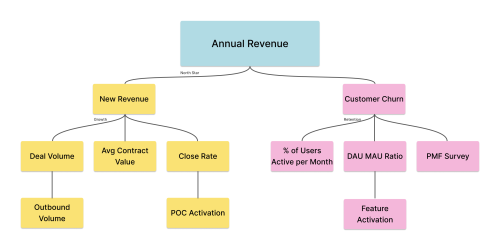
How data teams can continuously grow business impact with Metric Trees
Metric Trees are a tool to build a model of your business using hierarchical metrics. They provide an instrumented map of business performance starting with North Star metrics and drill down to controllable input metrics. North Star metrics are the top level metric that the entire company is aiming to drive. A Metric Tree enables your stakeholders to diagnose and attribute variations in metric performance with the ultimate goal of driving the North Star metric.

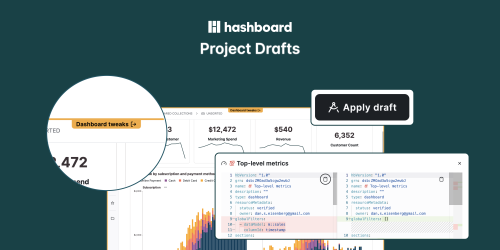
Code review for non-technical users
Project drafts allow you to propose changes across an entire project. You can queue up multiple changes across multiple metrics, dashboards and explorations. Let’s say you want to add a new business line across several metrics, dashboards and reports. You can stage all of those changes in a single project draft so people can compare before and after and see all of the changes in one place. Indicated by a clear orange banner that borders the entire application, your project draft is a standalone version of your project that you can review, analyze and interrogate.

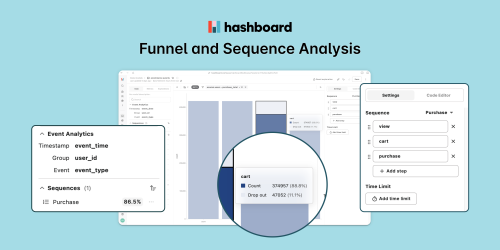
Unifying Warehouse Metrics and Funnel Metrics in Hashboard
The event analytics feature enables powerful funnel analytics right out of the box: you to chain together an arbitrary number of steps for user-based funnels and track retention and conversion.


It's Time! Two Strategies to Declutter Your BI Tools and Dashboards
As the days grow longer and the flowers start to bloom, now is the perfect time to declutter our BI tools and dashboards. By tidying up unused and outdated dashboards, you can create a better experience for your end users.

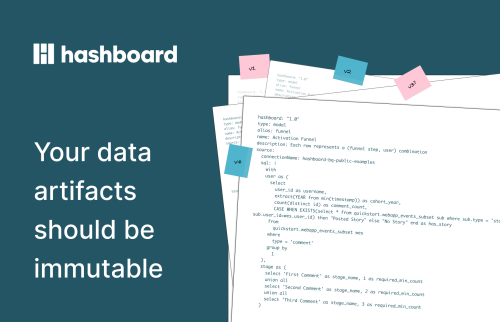
Your data artifacts should be immutable
At Hashboard, we're constantly exploring innovative ways to enhance data tooling for both end users and data engineers alike. Recently, we've been tinkering away to create versioning features that are flexible and friendly to users from a range of technical backgrounds. But to pull it off, we realized we needed to go back to the drawing board with some of our core data structures.
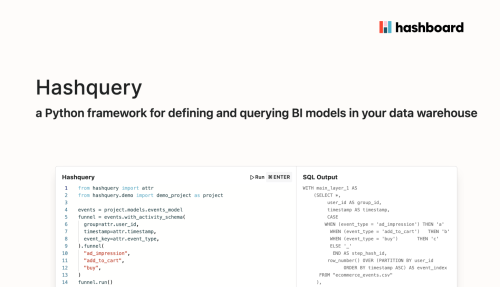
Hashquery: free the logic in your BI tool
BI tools like Tableau and Looker are great for creating standard reports, but they have one fatal flaw: once you create definitions, it’s nearly impossible to get the logic out. Calculations and definitions are trapped in these tools by design. The next generation of tools will need to free the logic — not only because today’s ecosystem of tools requires access to metrics logic, but also because Large Language Models will only be useful for analytics if they can tap into your organization’s core logic.

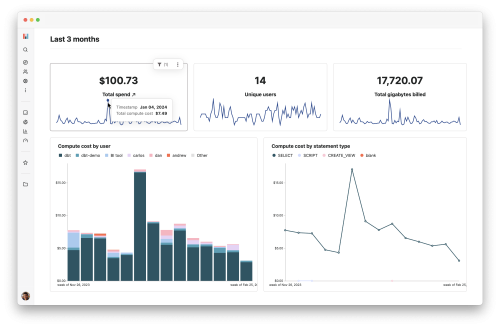
Introducing the BigQuery Cost Analyzer
Here at Hashboard, we use BigQuery as our data warehouse of choice to store our own analytics events. We also love dogfooding our product and analyzing our own data, including data about our BigQuery spending.

2023 data trends
Two major industry-wide trends affected data teams in 2023: the tech downturn and the rise of LLM's. We take a look at these and how it affects the Modern Data Stack and the current state of data analytics.

Utilizing Apache Arrow at Hashboard for performant insights
Apache Arrow has allowed our engineers to save time by leveraging existing solutions to common data problems, freeing us up to work on harder problems that require novel solutions.

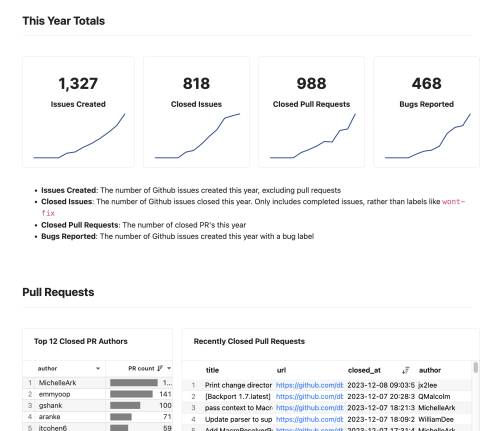
Build a Live Dashboard of Your GitHub Repo's Issues in 30 Minutes
In this guide, we'll set up a live dashboard using Hashboard, leveraging GitHub's REST API, GitHub Actions, and Hashboard itself. By the end, you'll have a comprehensive view of your repository's activity, with tools for detailed analysis and hourly refreshed data.

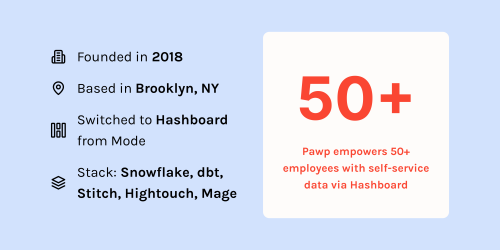
Hashboard x Pawp: Data from the ground up
Learn how Pawp, an app-based subscription veterinarian service, uses Hashboard to empower their entire team to self-serve data and analytics.
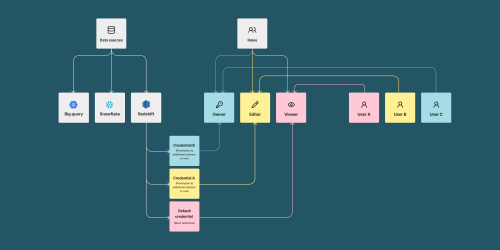
How to set up row- and column-level permissions in Redshift (and your Business Intelligence tool)
Implementing row- and column-level security at the database layer allows you to enforce these rules in a business intelligence tool as well as other tools that rely on the data warehouse. We’ll be showing an example of how to enforce database-level permissions using Amazon Redshift and how you can use it to enforce security and protect PII in a business intelligence tool– in our case, Hashboard.

Snow Leaderboard: Building an Application with Hashboard and Prefect
Building data applications does not have to be a slog. Modern tooling enables you to create lightweight applications that process and respond to large amounts of data and require minimal maintenance, especially when you want to be on top of the latest snowfall this ski season!

Guide to Using Hashboard for Product Marketing
A step by step guide of how to use Hashboard for interactive product marketing. Create interactive, shareable dashboards with your own data!

Analyzing 9 million healthcare insurance claims with MotherDuck and Hashboard
We’re excited to announce the Hashboard integration withMotherDuck and give a quick walkthrough of how it helps Hashboard build on our DuckDB use cases and examples. We love using DuckDB for our demos and MotherDuck has made the developer experience much better (and helps us scale our DuckDB use cases to much more data).

AI for Data Analysis: Expectations vs. Reality
Sharing our learnings from our AI assistant feature - how we developed it, what users actually did and what's next.

A brief history of business intelligence, modern day data transformation and building trust along the way
What we can learn from historical data problems and our modern day solutions.
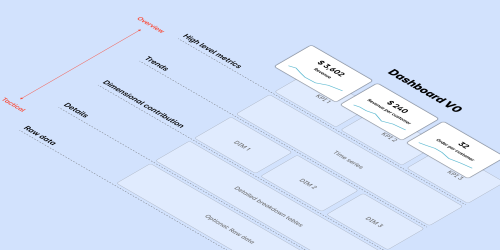
Data engineer's guide to building BI dashboards
Somehow you got tasked with building the dashboard to track [ fill in the blank ]. It turns out, there’s a lot of disparate skills involved in making a BI dashboard, not just data engineering skills. Sure, you’ll need some data manipulation skills, but you’ll also need visualization skills, analytical skills and product skills to make a useful dashboard people will actually use.

Hashboard x Beam: Leveraging Data to Better Serve Those in Need
How Beam used Hashboard to help distribute millions of dollars in aid and serve 60+ customers

BI demo in a box with DuckDB and dbt
Business Intelligence demos are hard to make reproducible because they live at the end of a long pipeline of tools and processes. Here's a guide to making reproducible and extendable BI examples with Hashboard, DuckDB and dbt.

Introducing Hashboard!
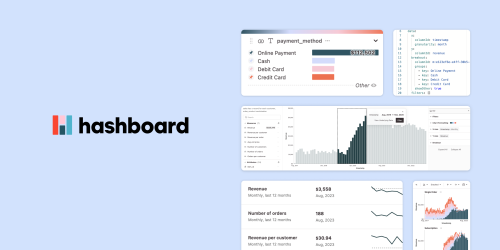
Glean.io is now Hashboard - and a huge v1.0 release!

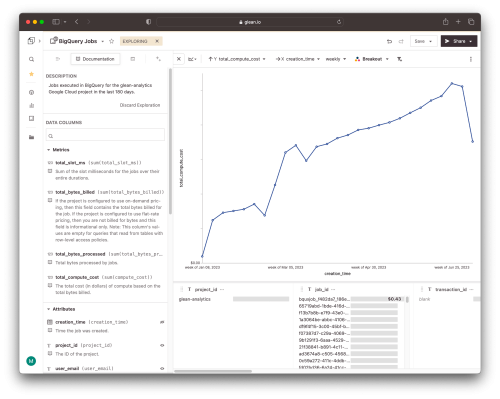
Monitoring BigQuery costs in Hashboard with dbt and GitHub Actions
Leveraging DataOps for an orderly, collaborative data culture

Choosing the Right BI Tool to Grow a Data-Driven Culture: Comparing Hashboard, Looker, Metabase, and Tableau
Why you should pick Hashboard, Looker, Metabase, or Tableau based on self service features and pricing.

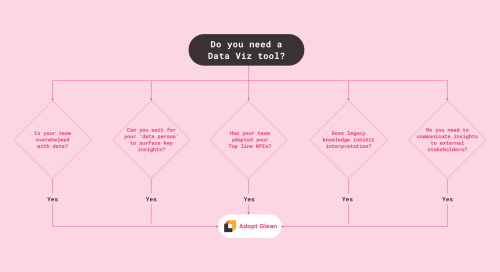
Five Signs It’s Time to Adopt a Data Visualization Tool
Timing will never be perfect for introducing a new tool to your stack. If you're considering the addition of a data viz tool, this post will provide guidance on identifying key signs that indicate it's probably time to take the plunge.

Security and Compliance at Hashboard
We're building Hashboard with the upmost care and consideration for our users' security and privacy. Rest easy knowing that we're SOCII certified, HIPAA compliant and more.

Why I Stopped Worrying and Learned to Love Denormalized Tables
My journey of how I've ended up embracing denormalized tables, how to use tools like dbt to bridge normalized and denormalized tables, and how denormalized data accelerates exploratory data analysis and self service analytics.


Making Custom Colors “Just Work” in Hashboard
It comes in as a simple request: “we want custom colors for our charts in Hashboard”. It seems simple, but doing it well is more nuanced than you may expect.

How to do Version Control for Business Intelligence
It’s surprisingly common to not have any version control for BI assets. If you don’t have it, it’s a good idea to get it in place sooner rather than later. This post covers the basics of how to get started.


Using DuckDB for not-so-big data in Hashboard
Big Data is cool - and so are infinitely scalable Data Warehouses. But sometimes, you just have not-so-big data. Or maybe you have a csv file and you don’t even know what a Data Warehouse is, or don’t care about the “Modern Data Stack” - like, what is that? That shouldn’t stop you from exploring your data in an intuitive, visual way in Hashboard.


Building in Public
We’re thrilled to announce the launch of our public Changelog and Product Roadmap! These two resources will provide an updated overview of all product changes, as well as a preview of items our team will be tackling in the future.

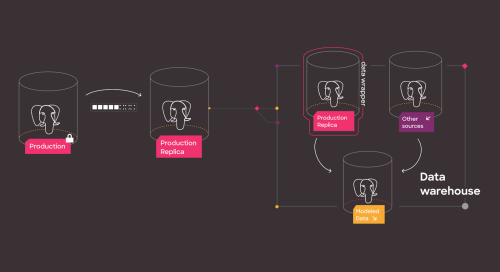
Set up your data warehouse on Postgres in 30 minutes
Sometimes you've got some data in postgres and you just want to start analyzing it. Here's the scrappy guide to get you jamming on analytics - a guide for founders, PM’s, engineers trying to hack something together quickly.

Your dashboard is probably broken
Allowing users to explore and experiment with your data is crucial for building a data-driven culture. But when a report has become a production system – a real product with real users that depend on it – it’s important to start treating it more like an application. DataOps lets you treat them that way.


From the archives: Introducing Glean
It’s never been easier to collect data and drop it in a database so you can analyze it. But what about getting to insights? Data visualization and reporting are hard - we're trying to make it easier.
