Why I Stopped Worrying and Learned to Love Denormalized Tables


Hey, I'm Andrew and I'm a product manager at Hashboard. Previously, I've worked on analytics in a variety of roles; analyst, data engineer, visualization specialist, and data scientist.
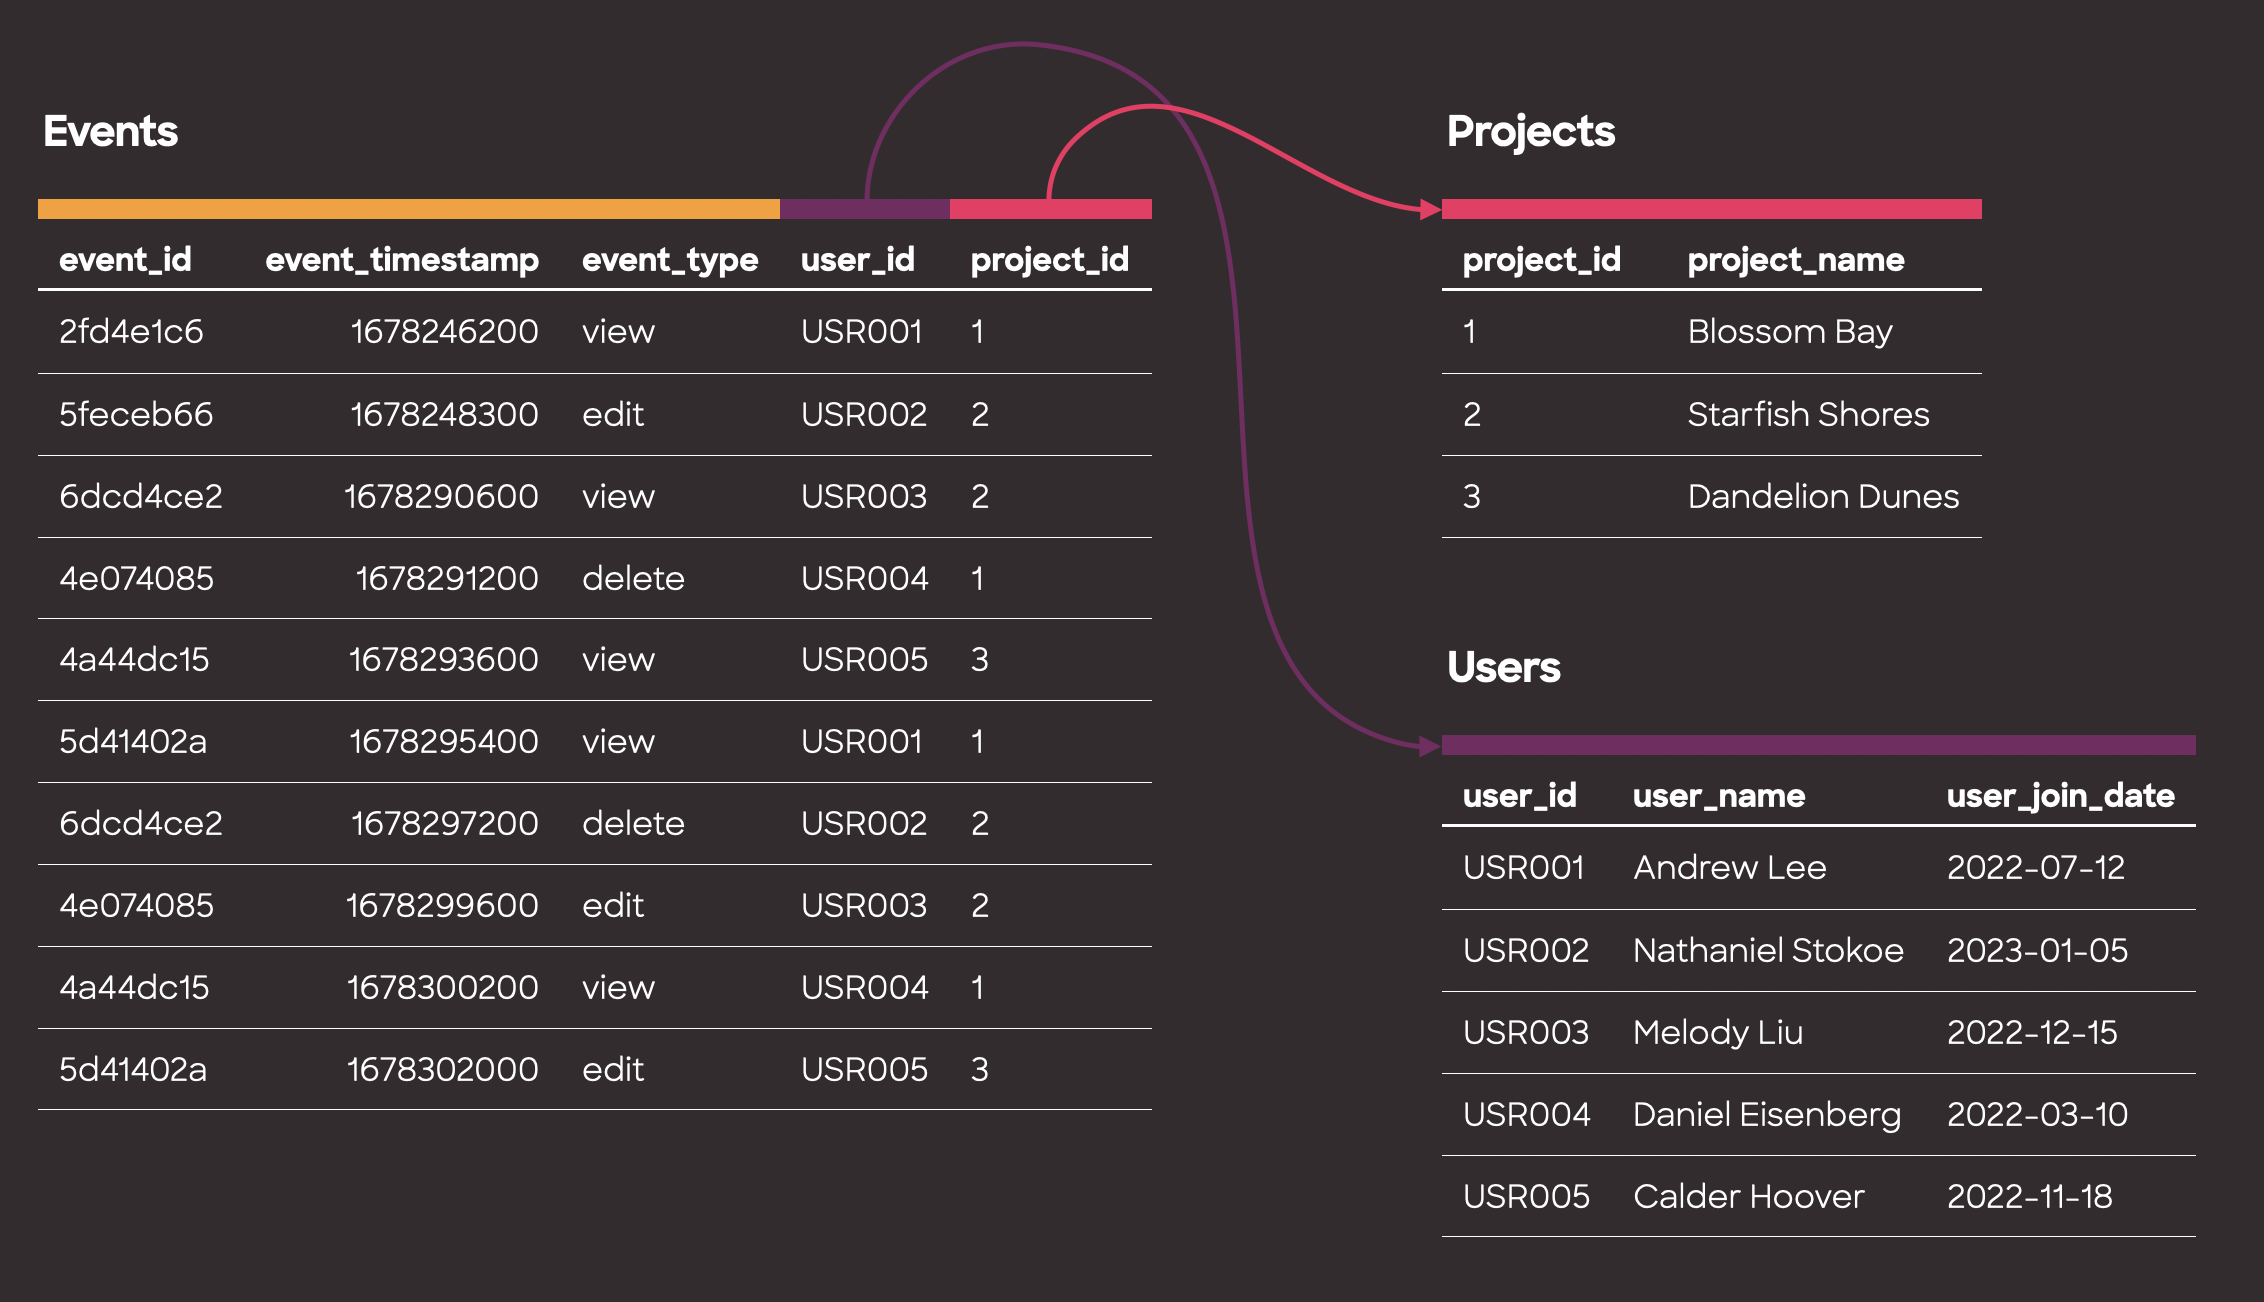
Normalized tables: Tables designed to avoid repeating information, keeping data organized and easy to maintain.
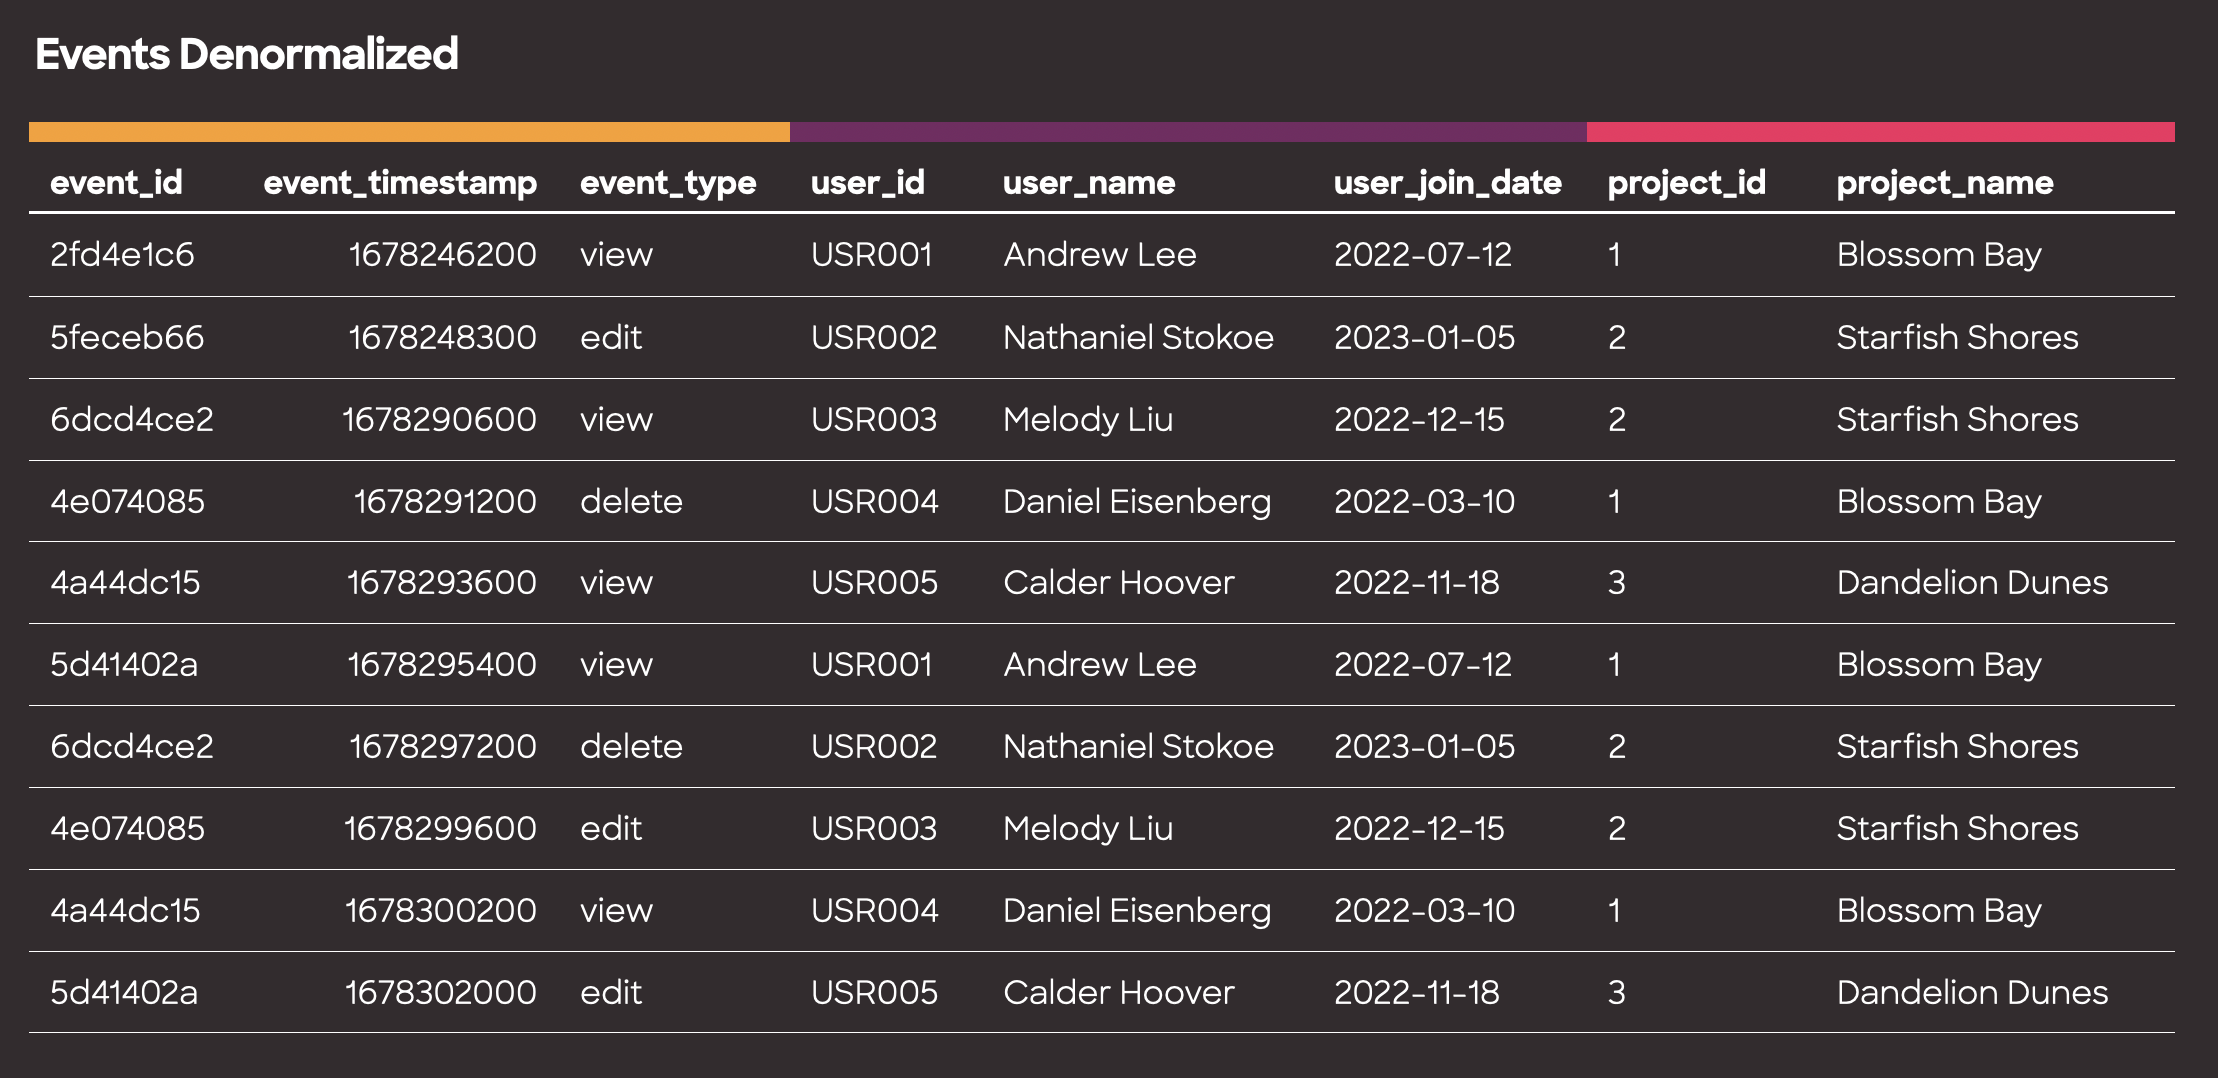
Denormalized tables: Tables that have repeated information, but make data retrieval faster and simpler to understand. aka One Big Table (OBT)
After years of meticulously modeling data in relational databases and avoiding duplication at all costs, I’ve come full circle on the power of wide flat tables for analytics.
In this post, I'll share my journey of how I've ended up embracing denormalized tables, how to use tools like dbt to bridge normalized and denormalized tables, and how denormalized data accelerates exploratory data analysis and self service analytics.
Quickly answering questions with spreadsheets and dataframes

Starting out as an analyst, I first learned to analyze data in Excel, then in Jupyter notebooks and R Studio. I spent a lot of time in live Q&A sessions with stakeholders answering questions about the metrics that mattered to them and figuring out why, why, and why.
Questions like "Are the metrics going up or down?" or "Why did revenue dip this day?" or "How does this segment compare to this one?" were common.
I could usually start off with a simple SQL query, but as we layered on business logic, the number of joins would inevitably explode. I’d have to pause the live Q&A and follow up after I untangled the query I had generated.
I quickly learned that writing one giant query with a bunch of joins or even bunch of Python helper functions could get me stuck. My transformation functions weren't flexible enough, or my joins were too complicated to answer the endless variety of questions thrown my way while keeping the numbers correct.
Instead, the easiest way to be fast, nimble, and answer all the unexpected questions was to prepare a giant table or dataframe and limit myself to it. As long as I understood the table's contents, it was harder to make mistakes. I could group by and aggregate on the fly with confidence.
Conveniently, I also found this made transporting data across a variety of tools really convenient. I could play with the same table in Excel pivot tables or a Pandas notebook since I could export to a single CSV.
Learning to model data

As my technical skills grew, I took on more responsibilities such as data ingestion, ETL pipelines, and application building. Along the way, I learned about data modeling and schema design to maintain organized and easily maintainable databases.
select name from users just makes sense! I was a firm believer in the standard practices of normalization and I began my projects thinking about foreign key relationships and indexing.
I believed that duplicate data would lead to inefficiencies and errors, so I avoided it at all costs.
However, as I gained more experience and began building tools for exploratory data analysis, I discovered a surprise: those big, flat tables I used to make as an analyst were still incredibly powerful and valuable for exploring data.
Without the flat table in the warehouse, I’d end up having the same big query or sequence of Pandas spaghetti in a dozen different places. Inevitably, the logic would drift and I couldn’t rely on older resources.
I started baking the join and filter logic into database views so I could have freshly prepared data with a consistent structure. I could run ETL into a normalized schema that made it easy to validate data hygiene and quality, but still quickly query data using the denormalized view. It turned out normalizing my data was helping me denormalize my data.
The Aha Moment: Leveraging dbt and modern warehouses to unlock the power of denormalization

Transformation tools such as dbt (Data Build Tool) have revolutionized the management and maintenance of denormalized tables. With dbt, we can establish clear relationships between table abstractions, create denormalized analytics datasets on top of them, and ensure data integrity and consistency with tests.
Modern warehouses, such as Snowflake and BigQuery, combined with ELT (extract load transform) patterns allowed me to simplify my pipeline code into a bunch of SQL and generally never have to worry about the volume of data I was processing. The excellent query performance of denormalized tables in modern warehouses also make it quicker to run analyses.
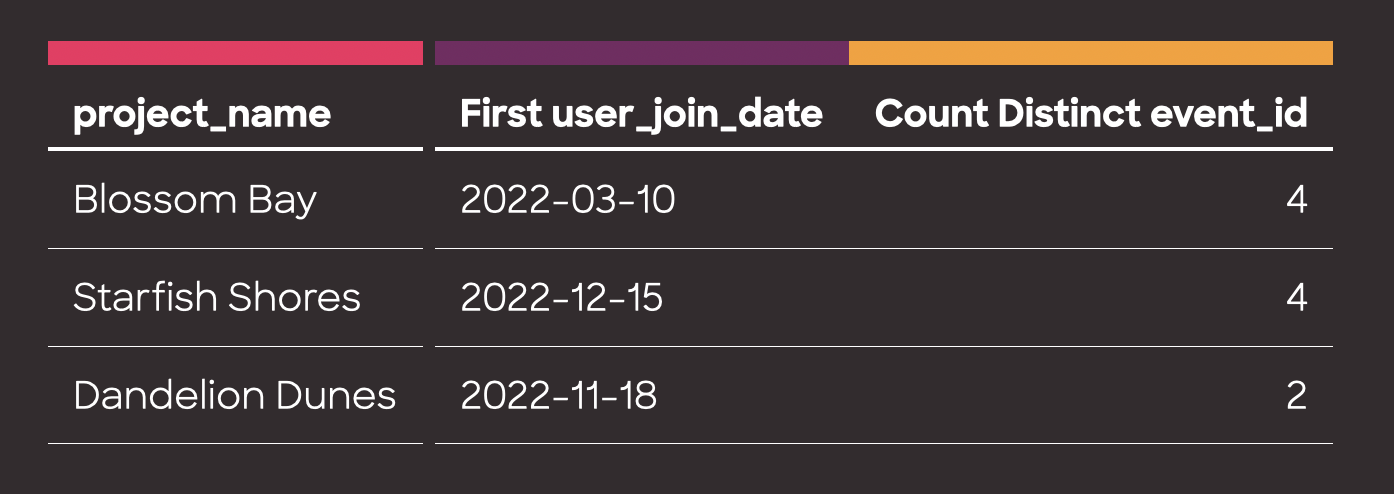
I could now safely build an analytics table of millions of records and build many different visualizations and analyses with simple filters and aggregations, no complex joins or CTE’s required. The many columns ensured I could flexibly create the series and aggregations I needed.
If there were any data quality issues, I could easily rebuild my tables with dbt and the new data would flow into my charts and dashboards.
Conclusion
Denormalized tables prioritize performance and simplicity, allowing data redundancy and duplicate info for faster queries. By embracing denormalization, we can create efficient, maintainable data models that promote insightful analysis.
So, why not give denormalized tables a chance? You might just find yourself wondering why you ever worried in the first place.
If you’re looking for a BI tool that fully takes advantage of denormalized tables and the rest of the modern data stack, we’re building one at Hashboard! We’re built for quick and agile metrics exploration, with powerful data visualizations and tables. Come check us out!