I can go into the Figma Community and look at a set of icons or a design system and feel confident that I can import it into my own project and start playing around with them. Design assets are portable and easily plugable into different environments.
Same with software packages. I see a live demo of a Python package and I’m pretty sure I can pip install the package and use it myself.
Business Intelligence tools give me the exact opposite vibe. When I see a pretty demo on a marketing website, I have a sneaking suspicion I can’t use any of it or couldn’t get it working myself.
Looker has a whole library of Looker Blocks—but you need to bring your own data to play with the code. Which, if I’m curious about learning about Hubspot data but don’t want to connect my own data, isn’t particularly interesting or useful.
If you want evidence that BI tools aren't particularly shareable / reproducible across organizations: you can just look at their public examples: they are very hard to reproduce!
BI is hard to make reproducible
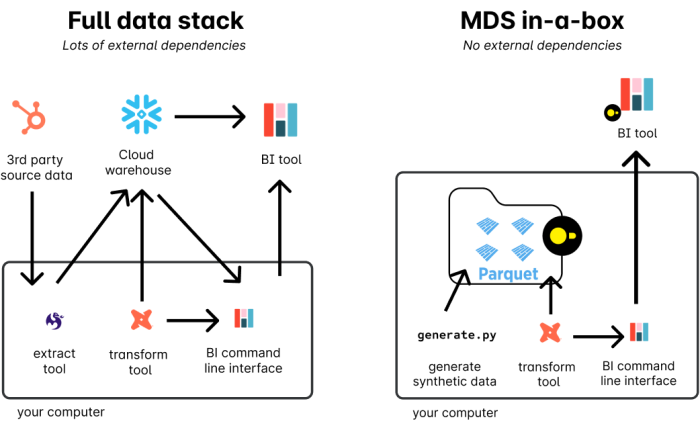
Business Intelligence demos are hard to make reproducible because they live at the end of a long pipeline of tools and processes: extraction tools/loading tools, transformation and warehousing tools. Historically, BI tools have always carried a ton of external dependencies. If you want to try them out, you need data and you need a database to store that data.
Using DuckDB for the Pizza Bytes retail demo
I’m excited for DuckDB because it reduces your dependence on external tools and resources, which makes it great for small prototypes and demos.
When I started developing the Pizza Bytes demo for the launch of Hashboard (fka Glean), I wanted to build example code people could easily pick up and reproduce in their own projects. To make that possible, I ended up pulling inspiration from the rewritten and improved Jaffle Shop which is self-contained and follows the MDS-in-a-box pattern to pull it off: by using parquet files as intermediates instead of a data warehouse.
MDS BI demo in a Box
The Modern Data Stack in a Box introduces a single-node analytics approach that capitalizes on DuckDB, Meltano and dbt to make a whole data processing pipeline run on a single machine. This is really useful for testing… and demos! Contrasting with the complexities often associated with scaling data pipelines, this method emphasizes trying to create a complete analytics environment locally.
A typical Modern Data Stack (MDS) incorporates various tools to handle the full data lifecycle.
MDS-in-a-box promises developers simplified operations, reduced costs and easy deployment options when you are running tests or other experiments. The stack is especially useful for open-source contributors and SaaS vendors, as it provides a contained example that's easy to share and replicate.

This is a great way to experiment, build demo’s and prototype solutions. Still TBD whether DuckDB is useful for production analytical workloads - but I’m excited to see MotherDuck and other entrants try to pull it off!
Running the Pizza Bytes demo (in-a-box)
Pizza Bytes follows this same paradigm: use a single machine to run all the parts of your data processing pipeline, with parquet files as intermediates and no external dependencies. Here are the steps to building our Pizza Bytes demo on a single node. Note that the makefile will automatically run the extract, transform and dashboard creation scripts listed below.
git clone https://github.com/hashboard-hq/examples.git

cd retail_example
pip install -r requirements.txt
# or hb token if you already have an account from the internet
hb signup
# make runs the python data gen scripts, dbt and Hashboard
make

# now goto hashboard.com/app to check out your newly deployed demo
Step by step instructions (instead of the make script)
1. Extract and Transform synthetic data
Data is generated synthetically with python scripts and written to parquet files. The scripts were mostly written with chat gpt and generate synthetic trends in the data.
python generate_data.py
python generate_customers.py
python generate_marketing.py
2. Transform data with dbt dbt
Just run dbt:
dbt runDbt will operate on the parquet files directly and the output will also be parquet files. This is enabled in the profiles.yml file which tells dbt to output parquet files:
duckdb_profile:
  outputs:
    dev:
      type: duckdb
      external_root: ./data_catalog/dbt/
      extensions:
        - parquet
      threads: 4
  target: dev
The example also maps our python-generated parquet files as a dbt source, so that dbt models can reference the parquet files in _generated_sources.yml
sources:
  - name: generated_sources
    meta:
      external_location: "./data_catalog/{name}.parquet"
    tables:
      - name: customers
      - name: sales_data
3. Deploy BI with Hashboard
The metadata to produce Hashboard models is embedded right alongside the dbt models (in this example, but it’s also possible to separate this config into separate config files). We also have a few other resources (like a color palette) configured in the project.
When a Hashboard model is attached to a dbt model, it looks for the corresponding “tables” in the data warehouse attached to the dbt models. Since there isn’t a data warehouse, Hashboard expects to see appropriately named parquet files. We’ll upload the parquet files that are generated in the dbt pipeline as a first step to make sure the deployment works properly.
hb upload ./data_catalog/dbt/*.parquet
hb preview --dbt
hb deploy --dbt
The magic that makes this work is configured in the dbt_project.yml
models:
  # configure everything to be materialized as parquet
  +materialized: external
  +meta:
    hashboard-defaults: # this gets imported into every
      glean: "1.0"
      preventUpdatesFromUI: false
      duckdbDefaultFileExtension: parquet
      source:
        connectionName: Uploads
Note that you could build this whole demo without dbt as well. You would just reference the parquet files explicitly in the Hashboard configuration spec and you could even embed the logic and sql queries in the Hashboard models themselves. See the Hashboard CLI quickstart to get started with or without dbt.
The promise of Dashboard Templates
Templates (like Looker Blocks)—which could be used across orgs—come with their own set of challenges. Most pronounced is the issue of creating unified standards around terminology, semantics and definitions across different organizations. What is “churn”? What is a “New User”? What is an “Antineoplastic drug”?
We’re now seeing some standard models for pulling in data—for example, FiveTran manages a wealth of standard dbt pipelines for processing data from sources like Stripe or ERP systems. This process is straightforward because the inputs are relatively well constrained for source systems like Stripe.
Things get harder when you move past the source layer and dive into the semantics of an organization. It’s not just about handling Stripe data; it’s about synthesizing Stripe data in a way that works with your particular business model and the specific way that your org defines and structures data.
Because it’s still so difficult to share data across organizations, we aren’t yet seeing the deep level of collaboration that can solve these common semantic problems.
My hope is that our synthetic example data is a modest attempt and starting point for sharing examples between organizations and building mutual knowledge.
