Utilizing Apache Arrow at Hashboard for performant insights


Hello! I'm Nathaniel, a software engineer at Hashboard. Throughout my career, I've been fortunate to design and develop enterprise mobile and web applications for a diverse array of users, including those in governmental, educational, and consumer sectors. Building data exploration software, however, is a unique technical challenge, especially when it comes to delivering data insights to our customers without sacrificing speed and reliability. At Hashboard, Apache Arrow helps us achieve these goals.
But 'what is Apache Arrow?' you may ask. Or maybe you’ve heard about Apache Arrow but are still unsure how it could help in building better data software. Or perhaps you were an early adopter, but haven’t kept up to date with the latest releases (like us up until a few months ago). If any of this sounds like you, read on. When you’re done, you will hopefully have a better understanding of what Apache Arrow is, some of the problems it can solve in your data application, and some examples of how to work with it.
What is Apache Arrow?
Apache Arrow is an open-source framework created to provide a common way to process data across heterogeneous data pipelines in the wake of the widespread proliferation of data tools. Developed as a universal language for in-memory data, Apache Arrow facilitates the seamless exchange of data between various systems and applications, regardless of the programming language in use.
In plain terms, Arrow provides a community-driven, common set of libraries and data structures that any data application can use to communicate with other data applications using Arrow.
The ability to “talk” between data applications with a shared API is particularly valuable when your application stack has multiple languages like JavaScript, Python, and Java since it eliminates many of the common challenges in data processing and serialization. For example, rather than coming up with your own proprietary schema for encoding data, you can use an Arrow Table (more on Tables later).
One of Arrow's key features is its columnar memory format. This format allows for the rapid and efficient processing of large datasets. In traditional row-oriented databases, data is stored in a sequence of rows. However, in a columnar format like Apache Arrow uses, the data is stored in columns. This approach is highly efficient for analytics and operations on large datasets, as it allows for faster retrieval, aggregation, and calculation of data stored in a single column. This is especially handy when dealing with operations that need to process or analyze large amounts of data from a few specific columns, as it avoids loading unnecessary data, thereby speeding up the process.
Arrow represents columnar data with its Table data structure. An Arrow Table stores data and the schema of that data in a single data structure. Arrow’s various SDK’s all provide a way to instantiate a Table in the language of your choice. At the moment Arrow has SDK’s for C, C++, C#, Go, Java, JavaScript/Typescript, Julia, MATLAB, Python, R, Ruby, and Rust. Arrow also has great support for reading and writing Parquet files because they are both columnar-based.
Because of its interoperability between a variety of languages, it's no surprise that it has been integrated into data applications built at Google, Microsoft, Meta, Snowflake, and Dremio.
How Hashboard Uses Apache Arrow
Hashboard queries our customers’ data warehouses and returns the results of those queries to the user as a variety of different explorable visualizations. Along the way, Apache Arrow allows us to store data from enterprise data warehouses in-memory, cache it on the frontend or backend, manipulate the data with optional transformations and finally consume the result in our frontend JavaScript frameworks.
Data Serialization with Schemas
In our early days, JSON was our go-to format for transferring aggregated query results from the backend to the frontend. Its flexibility and ease of use in the browser made JSON an ideal choice during our rapid development phase. However, as convenient as JSON was, it had its limitations, particularly in terms of performance and the complexity of serializing and deserializing it. Converting Python data structures into JSON on the backend, and then interpreting them on the frontend, was a complex process that could slow down our data fetching and was prone to error.
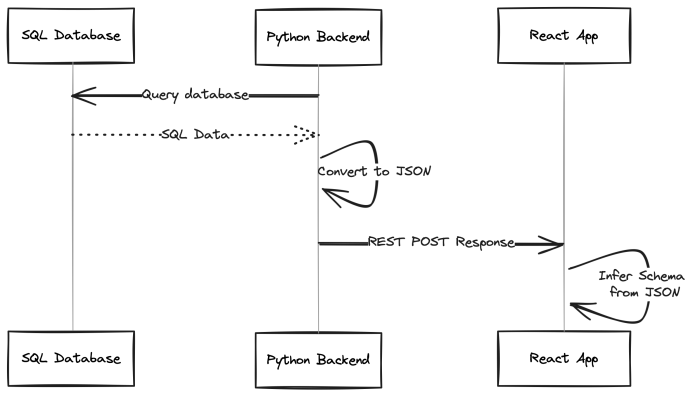
Relying on Arrow’s approach of combining data and schema within an Arrow Table, we have significantly optimized our data processing. This method allowed us to efficiently encode data and seamlessly transfer it over our API layer to end users’ clients. After we fetch results from a SQL query in our backend server, we store the results in an Arrow Table. When it is time to return a response to the frontend, we convert that Arrow Table into a byte stream with the help of Arrow’s Python SDK. The frontend reads that byte stream and converts it back into an Arrow Table using Arrow’s Javascript/Typescript SDK. And now we’ve got our data but also the schema of that data in an easy-to-use format, ready for additional data transformations before getting rendered as one of our many visualization types.
Post-Aggregation Transformations
Arrow also critically helps us build fast post-aggregation calculations. Once aggregated data reaches the frontend, we often need to perform additional transformations, such as pruning empty data or expanding the domain of a dimension to account for gaps. These tasks, while crucial, don't necessarily require the heavy lifting of our data warehouse resources.
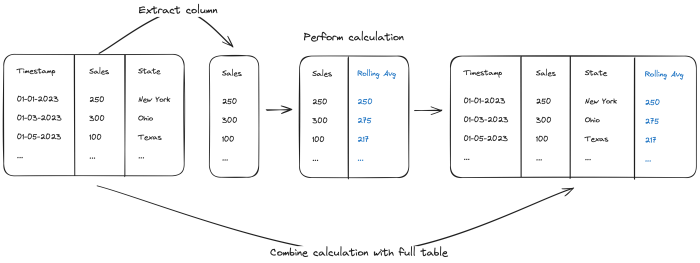
Here’s where Arrow’s columnar format comes in handy. One of the post-aggregation calculations we provide is a rolling average over a measure in your dataset. Let’s say we have some sales data and want to know what the rolling average of our sales is over a given period. We can use the functions provided in Arrow’s Table implementation and extract the “sales” column (technically it’s a Vector— more on this later). Next, we can iterate over the values in that column, store the results of that calculation in a new column, and return just that new column. Finally, we can graft that column onto the original Arrow Table and send the data along to be visualized. This approach not only saves valuable processing time but also enhances our application's responsiveness and user experience.
Leveraging DuckDB
Here at Hashboard we’re big fans of MotherDuck, so it’s no surprise we were excited to integrate DuckDB-WASM into our frontend client. DuckDB's implementation in WebAssembly allows us to run complex data transformations in the client without changing the underlying format. Being able to move certain aspects of our data processing, like post-aggregation calculations, into the frontend shifts some of the data processing workload and allows us to come up with creative ways to speed up the delivery of insights.
🦆 What’s 'DuckDB'?
DuckDB is an in-process SQL database management system, optimized for analytical queries. It's known for its fast, on-the-fly data processing capabilities, making it a popular choice for analytics and data science applications. Unlike traditional database systems, DuckDB is designed to be embedded within an application, offering a unique blend of performance and convenience.
Hashboard not only uses DuckDB internally, we integrate with DuckDB as a full-fledged data source. Read more about our integration with DuckDB.
If you are interested in exploring more about DuckDB, additional information and resources can be found on their official website.
DuckDB can process data natively in the Arrow Table format since, like Arrow, DuckDb is built on the columnar data format. By storing our data in Arrow format, we can seamlessly feed it into DuckDB running in the browser, perform the necessary SQL queries, and visualize the results almost instantly. This setup not only reduces the load on our servers but also provides a more interactive and responsive experience for our users.
But our usage of DuckDB isn’t limited to our frontend client. We also use DuckDB in our backend to query flat files uploaded by our users. When a Hashboard user uploads a CSV file from our client, we load the data from that CSV into a DuckDB database running in the application server layer and can query that data like any other data connections our users may have. And because DuckDB natively exports the results of its queries as an Arrow Table, we can reuse the vast majority of the data aggregation logic we built for more traditional cloud-based data warehouses.
Trade-offs
We’ve spent a lot of time so far singing the praises of Apache Arrow, but there were some challenges we had to overcome to get to the point we’re at today.
API changes
Earlier, I mentioned that we were relatively early adopters of Apache Arrow. We started using Arrow in mid-2021 with version 4. At this point, Arrow had been out of beta for about a year. Later that year we upgraded to version 6, and it wasn’t until about a year later we got to version 8.
And version 8 is where we sat for over a year. It wasn’t until we wanted to integrate DuckDB-WASM that we needed to upgrade to the latest version, 14. Each of these upgrades introduced significant breaking changes, which is to be expected with major version updates. But the pace of these changes was fast, as in an update with a breaking change every 6 months on average.
When updating our code to work with Arrow 14, there we a whole host of things we had to fix:
Goodbye columns, hello vectors
The Table class changed from being a collection of Columns, to a collection of Vectors. The difference was that a Column had data and the schema for that column of data, while a vector was just data. Previously we could rely on just passing a Column around because it had the schema, but now we needed to plumb the schema information for a Vector separately.
New constructors
Along with the change from Columns to Vectors, the way you instantiate an Arrow Table in JavaScript changed significantly. Previously you could simply pass an array of Columns to the constructor because Columns contained data and the schema for that data. With the change to Vectors, the constructor pattern we found most useful was passing a map of column name keys to Vectors. This seems like a small change but for us, it meant a significant refactor to all the places we created new Tables.
A dearth of documentation
The documentation for the latest versions of Apache Arrow leaves something to be desired. There isn't a ton of clear examples and our team often just went and read the source code or the test files to get a better understanding of the API. To be fair, Arrow is open source, so I get it that thorough documentation often takes a back seat to actual improvements to the codebase. I would rather have less documentation and a working library than great documentation and a library riddled with bugs.
Predicates were predi-cut
In older versions of Arrow, there was a handy set of functions that let you lazily define filtering logic for columns. This allowed you to build up a bunch of filtering rules across multiple functions of steps in your data processing, and then execute them all at once when ready. When we upgraded to v14, we found the predicate/filtering functionality was stripped out. This meant we had to rewrite a lot of this logic ourselves.
Typing turmoil
During our data processing, we often break apart Arrow Tables and put them back together with newly created vectors. We noticed that the inferred typing when manually creating an Arrow Table worked slightly differently after the upgrade. This meant we had to improve some of our logic during post-aggregation calculations to ensure that the resultant Vectors were typed correctly.
Debugging
For all its power and flexibility, Apache Arrow does make debugging a bit harder, especially when it comes to inspecting your data.
Network requests
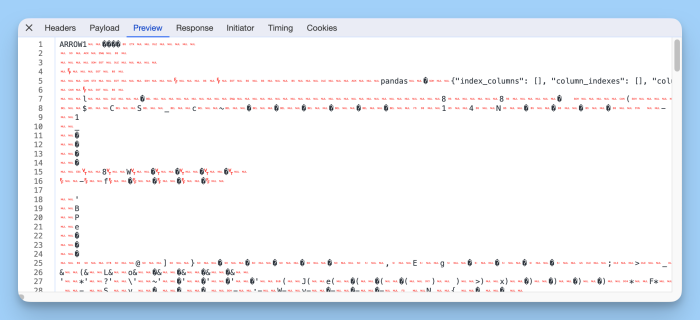
Beyond API changes, one thing we do miss from our days of just sending JSON over the wire was the ease of inspecting that data in browser dev tools. Since Arrow encodes data as a byte stream, the output is meaningless in your network tab. Here’s an example of some New York City 311 data, sent as arrow data, from Chrome’s network tab:
Safari doesn’t even make it that far. It just gives up and shows you a 404 warning despite the response header containing a success code.
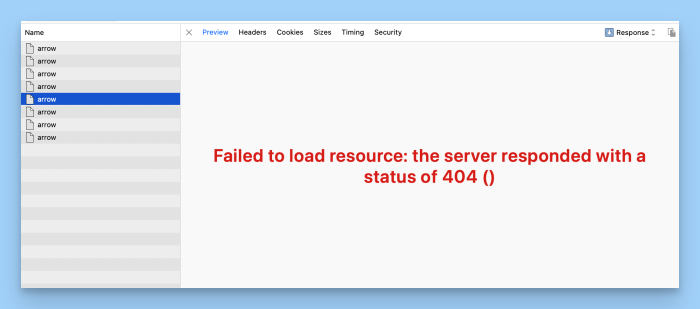
These issues make me somewhat nostalgic for when we would just send JSON responses, because browsers understand JSON and can give a meaningful preview of the response object, allowing you to spot-check the results.
Typescript Debugging
Once an Arrow Table gets into Typescript, it gets a little easier to debug but not by much. If you have a breakpoint in your code and inspect an Arrow Table, it might look something like this:
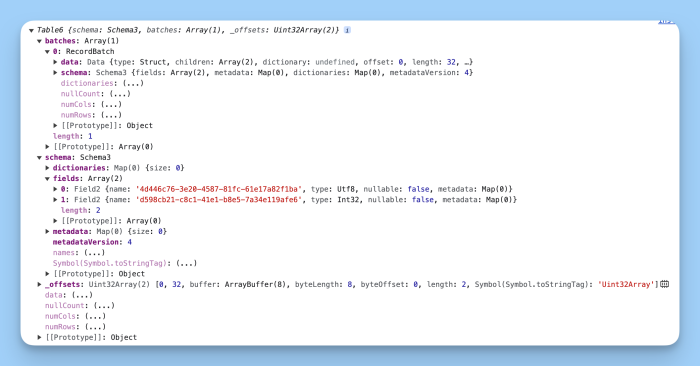
The information you are often looking for, like the schema fields and the data, is all there, just buried a bit. When debugging Arrow Tables you will find yourself iterating columns and printing their contents as JSON a lot.
Wrapping up
I hope this dive into Apache Arrow has been somewhat interesting. To be honest, this post has only scratched the surface of how we work with Arrow, but I think it provides a good summary of what it can do for data applications as well as shares some of the things we've learned along the way to where we are now.

At Hashboard, we’re always looking for ways to improve our software and provide our customers with the best possible experience. Apache Arrow has helped our engineers save time by leveraging existing solutions to common data problems, freeing us up to work on harder problems that require novel solutions. This mirrors our approach to how Hashboard itself should work. We want Hashboard to solve a lot of the easy, repetitive problems when it comes to modeling, exploring, and sharing your data, saving you time to do the hard stuff, like finding novel business insights that were otherwise hidden.