April 24th, 2024
Pie charts

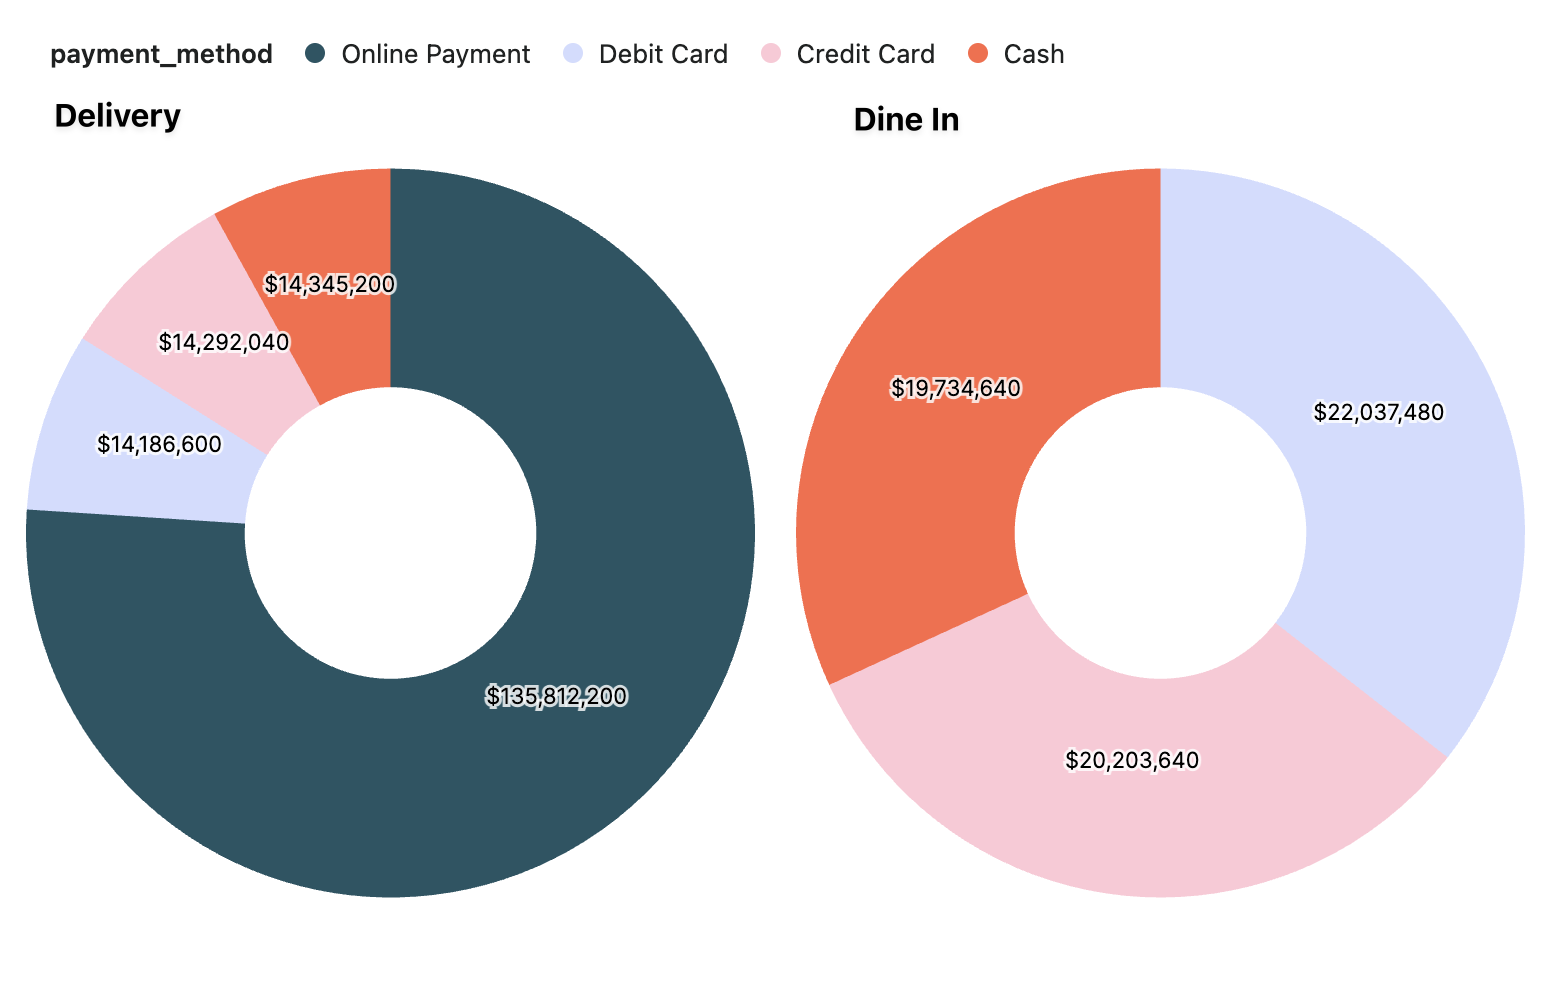
Introducing pie/donut charts, the latest upgrade to Hashboard's visualization capabilities! Create a pie chart when you want to depict proportional relationships in categorical data.
You can even trellis them to compare multiple categories at once.