August 28th, 2023
Introducing the Data Tray

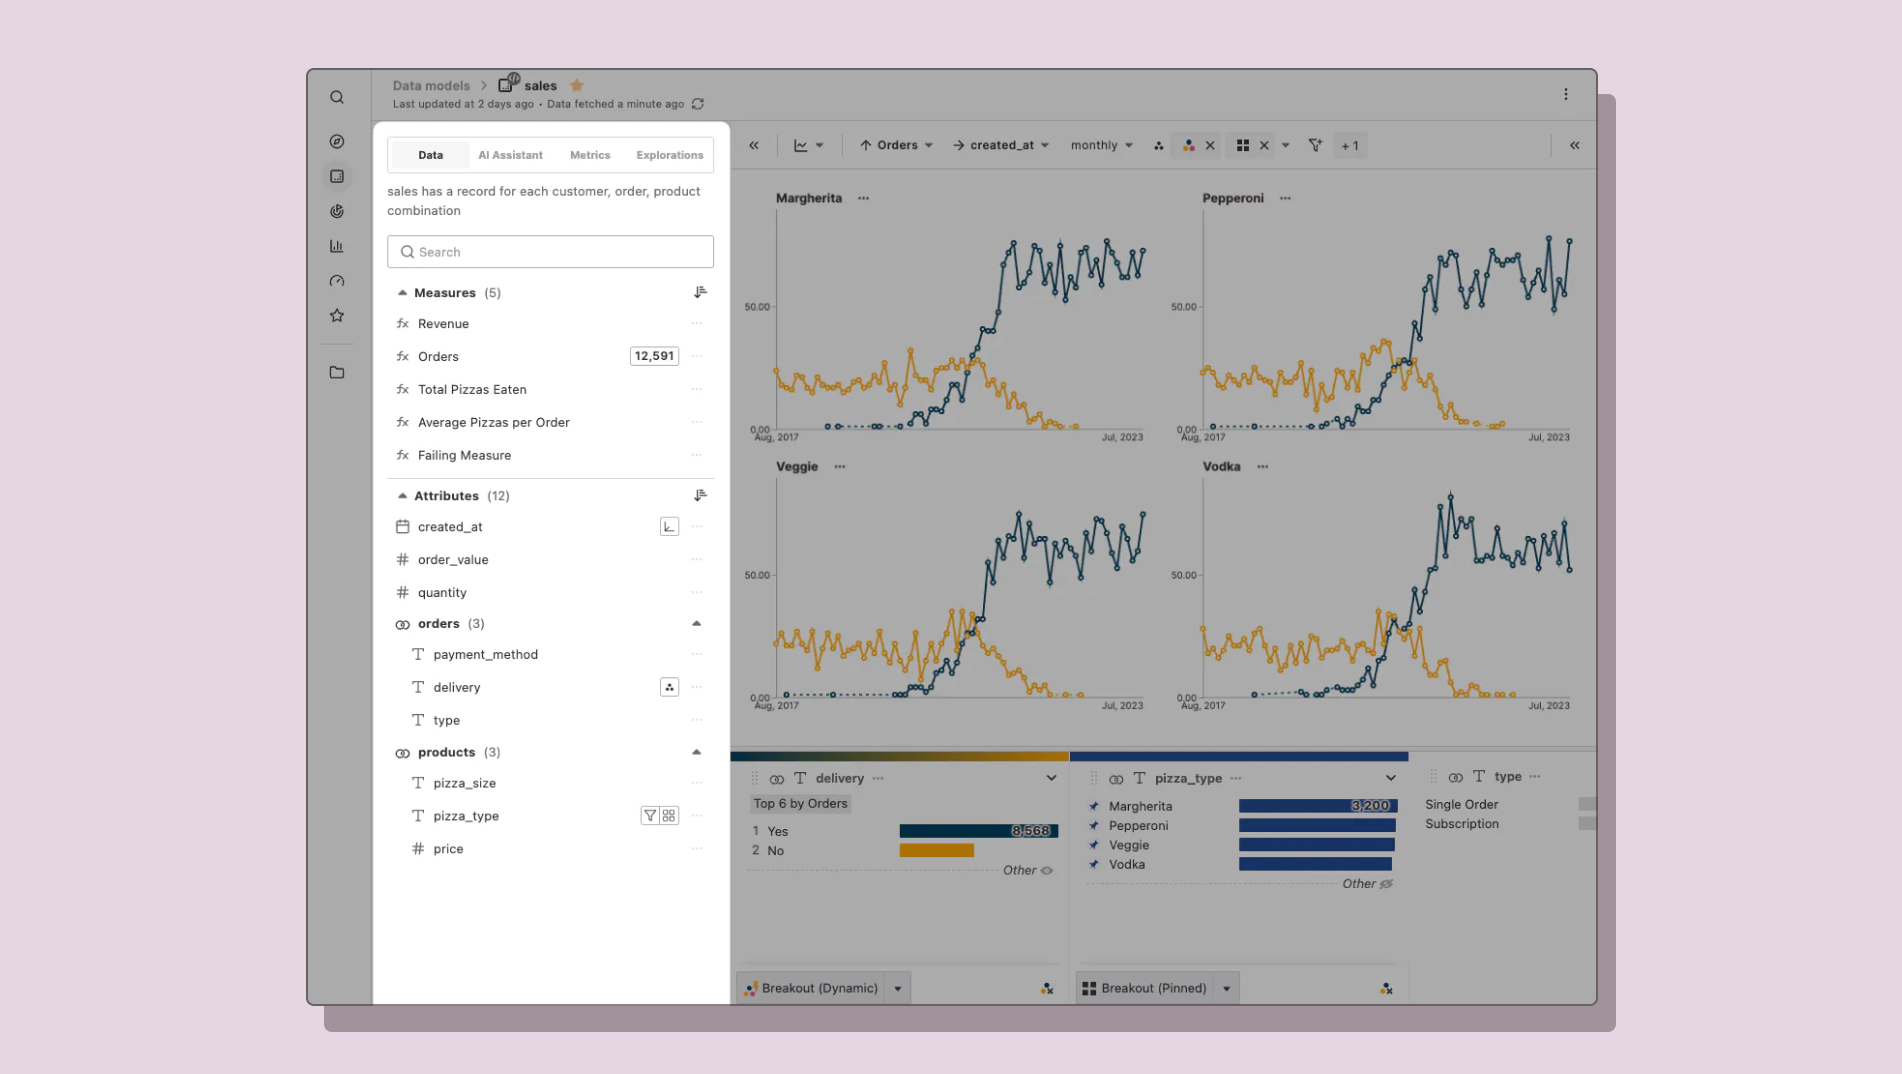
We’ve introduced a new approach to exploring data which makes it clear what data is available, and what actions you can take on each metric or attribute. This new interface should allow your curiosity to better guide you toward insights.
This is our first step in refining the data exploration experience to be clearer, faster, and (dare we say) fun-er.