December 10th, 2024
Calculations Table

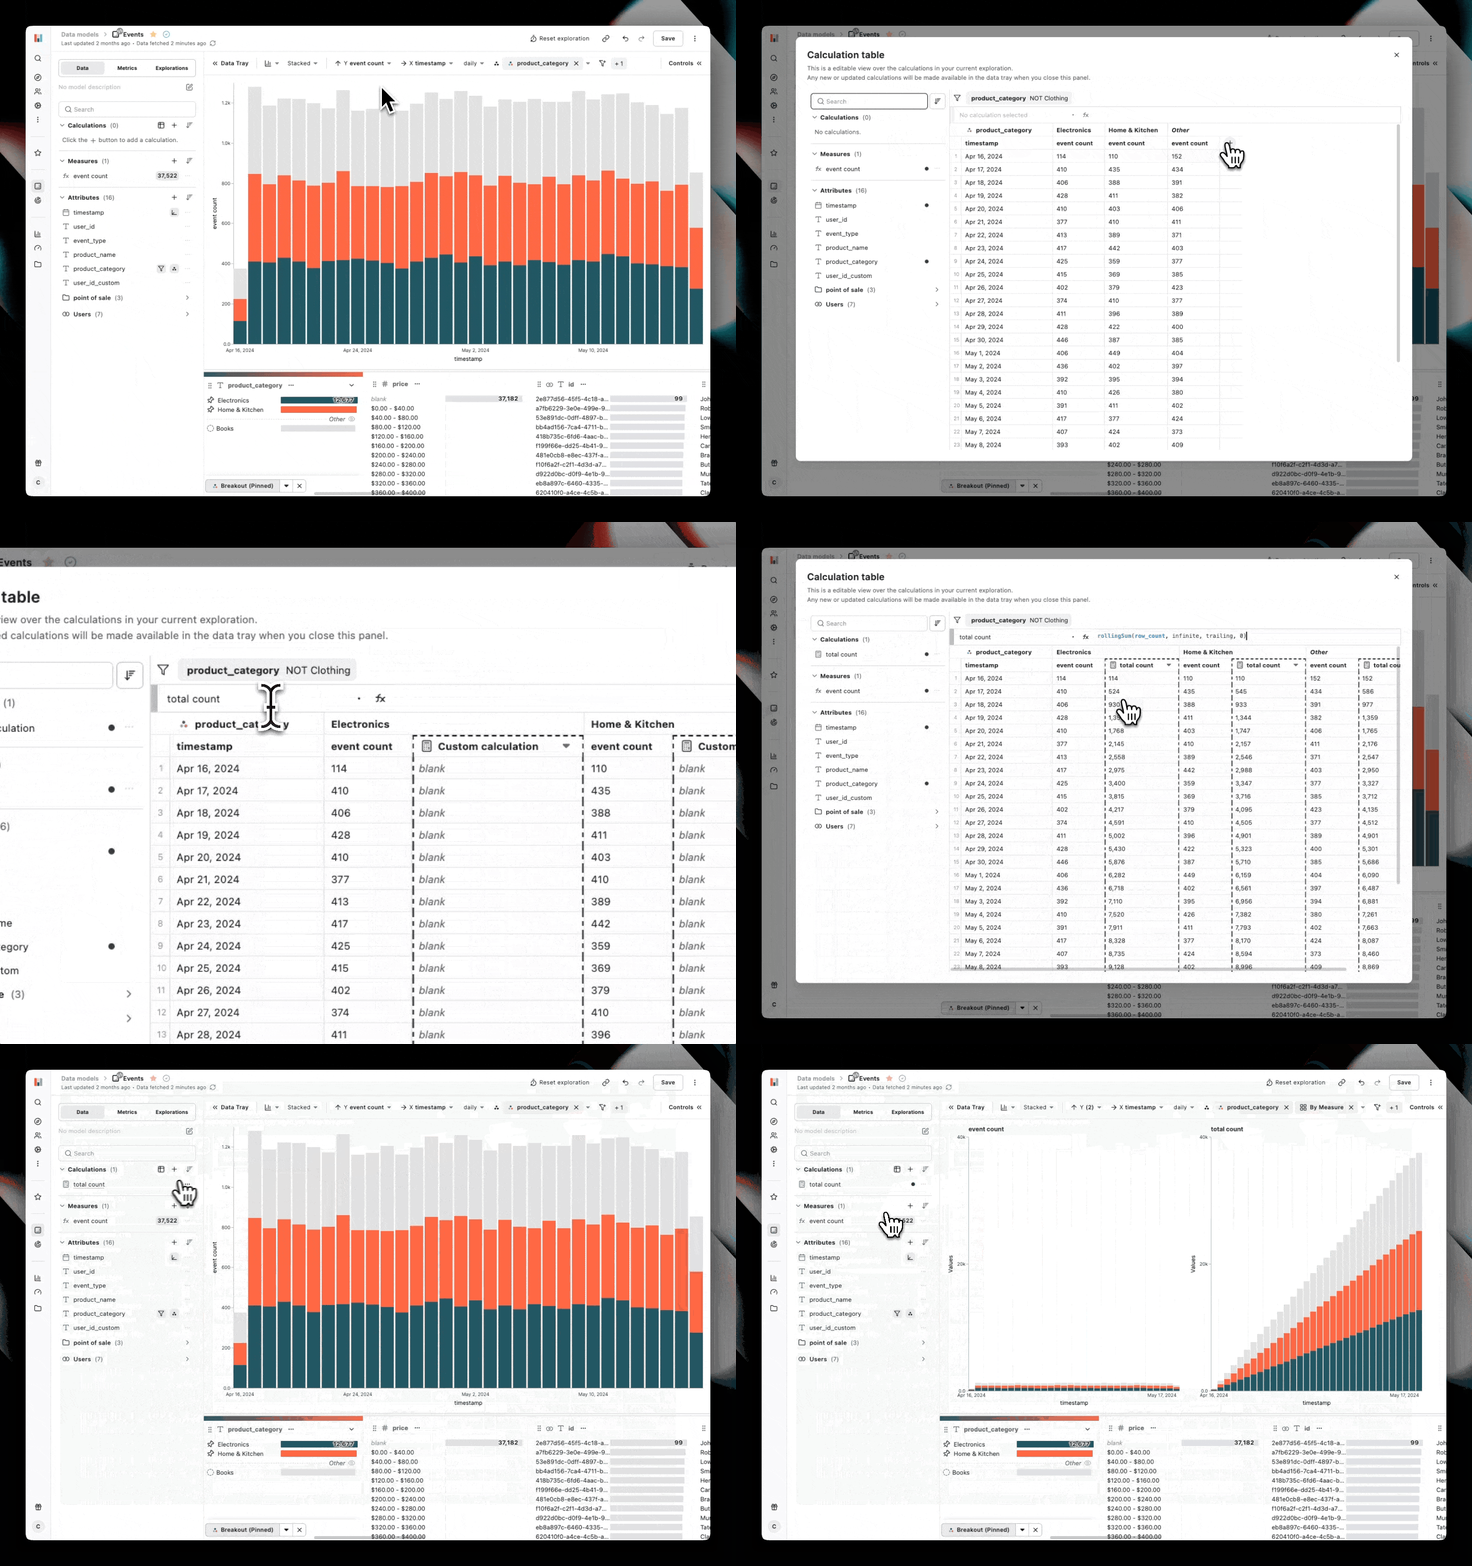
Today we're introducing the Calculation Table — a new, spreadsheet-style interface with a formula bar to quickly add, modify, or omit calculations on your current exploration.
The calculation table provides an overview of your chart's data frame, including any pivots, allowing you to test and verify your proposed changes before visualizing the results.